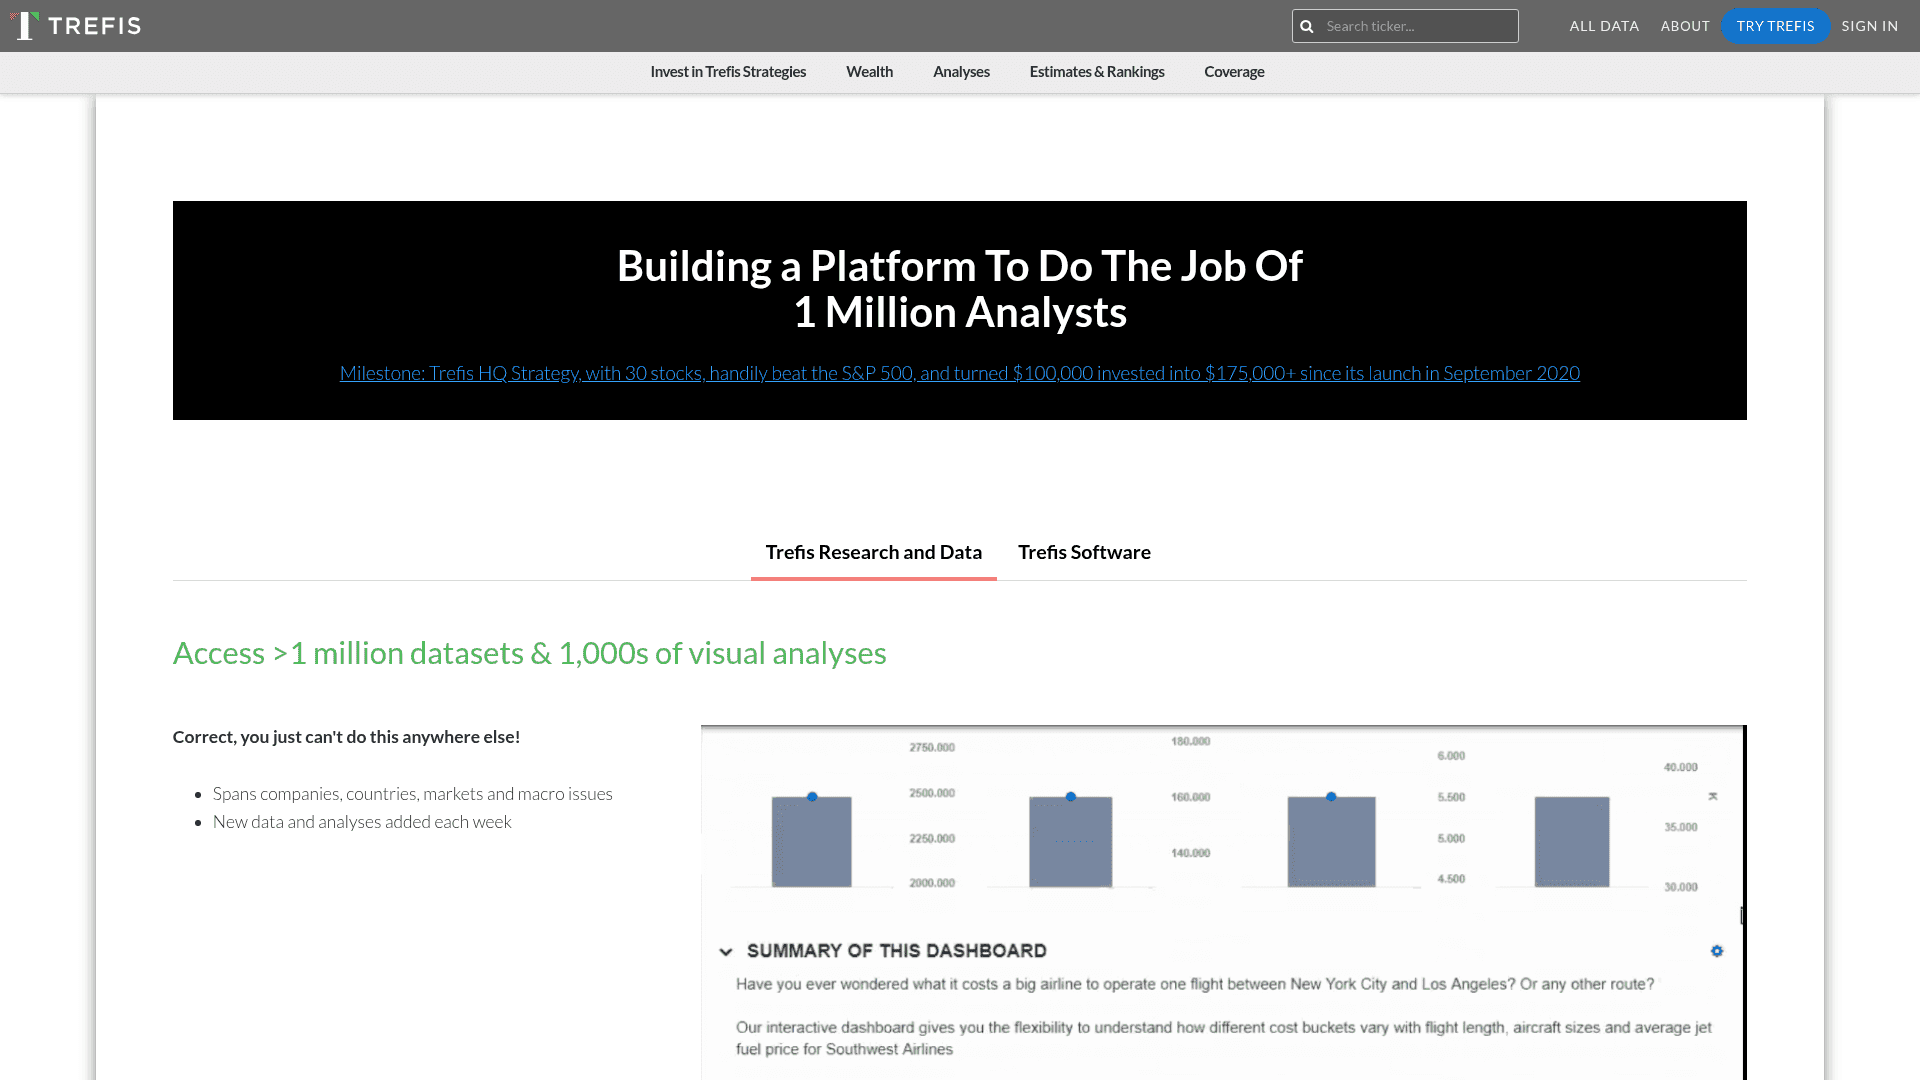
Trefis is a stock analysis platform built around one idea: a share price is the sum of a company's parts, so show the parts. Its models break a company's valuation into segments — for Apple, say, how much of the stock price comes from the iPhone versus services versus Macs — and let you adjust the assumptions behind each one to see how the price estimate moves.
That interactivity is what separates it from a standard research report. If you think a company's cloud division will grow faster than the analysts assume, you drag the forecast line up and watch the valuation recalculate. It turns a static price target into something you can argue with, which is both more honest and more instructive than a single number from an analyst.
What Trefis actually does
The platform maintains segment-level financial models for popular, mostly large-cap US stocks, each ending in a price estimate you can compare against the market price. Around the models sits a stream of short analyses and dashboards — over a million datasets, by the company's count — covering earnings, market share shifts, and macro themes. Trefis content also syndicates widely; you've probably seen its analyses on Forbes or Nasdaq without noticing the byline.
Everything runs on the divide-and-value method: forecast each business line's revenue and margin, discount it, and stack the pieces. It's standard sum-of-the-parts analysis, just presented visually and made editable.
Key features
- Interactive valuation models where you change assumptions and see the price estimate update
- Segment breakdowns showing what share of a stock's value each product line contributes
- Price estimates you can compare against the current market price
- Dashboards and analyses on earnings, competition, and market trends
- Scenario tools for testing how events like a product launch or downturn flow through to valuation
Who it's for
Individual investors who want to understand why a stock might be cheap or expensive rather than just being told; students and finance learners, for whom playing with a real model teaches more about valuation than a textbook chapter; and analysts who want a quick second opinion on which segments actually matter for a name they're covering.
Our take
We like Trefis most as a thinking tool. Seeing that one division drives most of a company's value — and that heroic assumptions about another division barely move the needle — is the kind of intuition that usually takes years of modeling to build, and Trefis hands it to you in a slider. For learning how valuation actually works, few tools are as direct.
The limitations are worth naming. Coverage skews toward well-known US large caps, so if you invest in small caps or international names you'll often find nothing. And the models are, by design, simplifications: a handful of drivers per segment, with plenty of judgment baked into the baseline forecasts you're tweaking. Treat the price estimates as structured opinions to stress-test your own thesis against, not as answers — and note that the polished experience sits behind a paywall aimed more at professional and institutional users than casual browsers.